New User Conversion Model
To build a model that can predict the conversion propensity with improved accuracy. Build logic and allocate points as per the new user's conversion propensity. I had a major role in the project, i.e., collating the data in the required format and allocating points to RNB users based on their past behavior.
Random Forest Classifier:- Random forests, also known as random decision forests, are a popular ensemble method that can beused to build predictive models for both classification and regression problems. Ensemble methods multiple learning models to gain better predictive results—in the case of a random forest, themodel creates an entire forest of random, uncorrelated decision trees to arrive at the best possible answer.
New User Conversion Model Steps:-
Step 1: We cleaned the data and removed or assigned null and unknown values in Python.
Step 2: After cleaning the data, we did exploratory data analysis and selected only those features that were significant. We tested the significance level of all the features (independent variables) in the table. The features were divided into numeric and categorical variables depending on the type of values present in the respective columns.
Step 3: We divided the dataset into 70:30 ratios for the training and test sets, respectively. We applied the Random Forest classifier model for predicting RNB users conversion on the train and test sets.
Step 4: Model trainings as previously explained, we gave the Random Forest Classifier a variety of features to decide on. Based on the pre-period data model, we would train and learn the behavior of RNB users. As per the activity of the users on the platform, it would predict the users acquisition propensity.
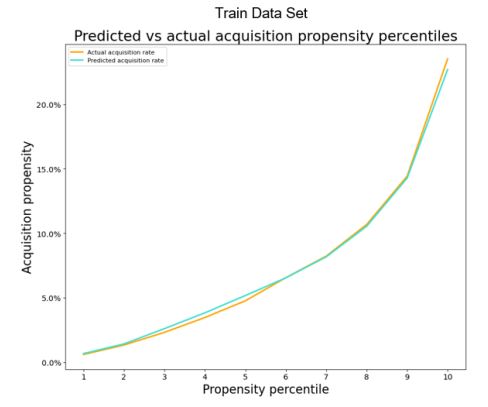
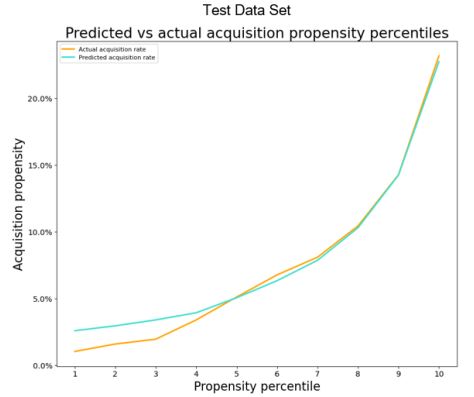
Step 5: Model accuracy by checking the overall average of the model and comparing it with the acquisition and predicted acquisition rates.
Step 6: We applied this model to the prediction data set, which is the post-period data set. The day on which we want to run the points property will be our post-date.
Step 7: We will get the UIDX and propensity percentile columns as a csv file, which will be further used to allocate points in payments admin.
Step 8: Points property, points are allocated based on the user’s probability of conversion; if the probability of conversion is high, i.e., in higher propensity percentiles, the user will be given low points. Points are distributed in 30:30:40 over decile range. Low deciles will get 500, medium deciles will get 400, and Higher deciles will get 300. The probability of conversion is inversely proportional to points.
Step 9: Notifications and SMS were sent to the RNB user base, as well as banners displayed on the platform.
To conclude, above-mentioned benefits, this model was to be used while distributing points in property. Due to targeted point distribution, we spent fewer points and achieved a lower delta gross margin for a similar number of acquisitions. The top 5 deciles covered 86.91% of total acquisition.